400-139-9200


How to monitor slow query requests in Elasticsearch #
Introduction #
Many times, the Elasticsearch cluster will experience peak data writing or query traffic. At this time, the Elasticsearch cluster will be under a lot of pressure. Through the monitoring and alertinging of the delay of the Elasticsearch index query. This allows us to locate which indexes are the most stressed on the Elasticsearch cluster. This article will introduce how to use the INFINI Console alerting function to monitor the slow query request index in Elasticsearch.
Prepare #
- Download and install the latest version of INFINI Console
- Register Elasticsearch cluster using INFINI Console
Create alerting rule #
Open INFINI Console in the browser, click on the left menu “Alerting” > Rules to enter the alerting management page, and then click
New button to enter the Create Alerting Rule page. Follow these steps to create an alerting rule:
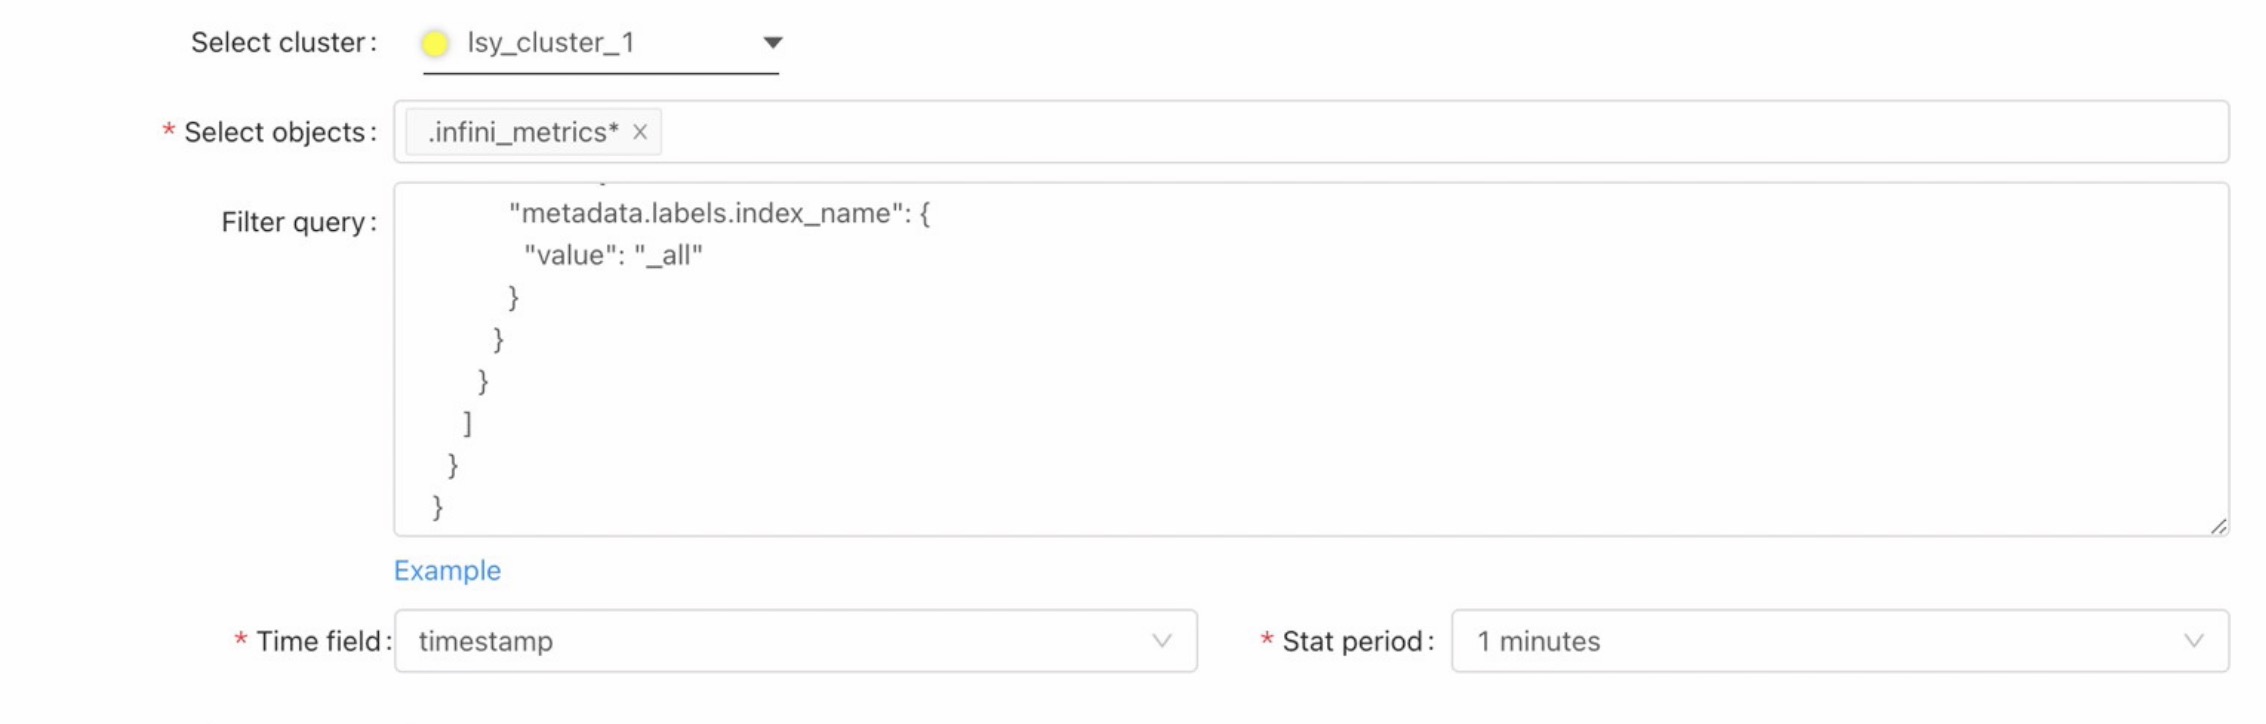
- Select the cluster (here you need to select the Elasticsearch cluster where the INFINI Console stores data, that is, the Elasticsearch cluster configured in the configuration file
console.yml, if it is not registered to the INFINI Console, please register first) - Input the alerting object
.infini_metrics*(select the index under the Elasticsearch cluster, or enter the index pattern, because the monitoring data collected by the INFINI Console is stored in the index .infini_metrics) - Input filter criteria (Elasticsearch query DSL)
Here we need to filter the monitoring metrics category to
index_stats, and the index name cannot be_all, the DSL is as follows:
{
    "bool": {
      "must": [
        {
          "term": {
            "metadata.name": {
              "value": "index_stats"
            }
          }
        },
        {
          "term": {
            "metadata.category": {
              "value": "elasticsearch"
            }
          }
        }
      ],
      "must_not": [
        {
          "term": {
            "metadata.labels.index_name": {
              "value": "_all"
            }
          }
        }
      ]
    }
  }
- Select time field
timestampand statistical period fordate histogramaggregation
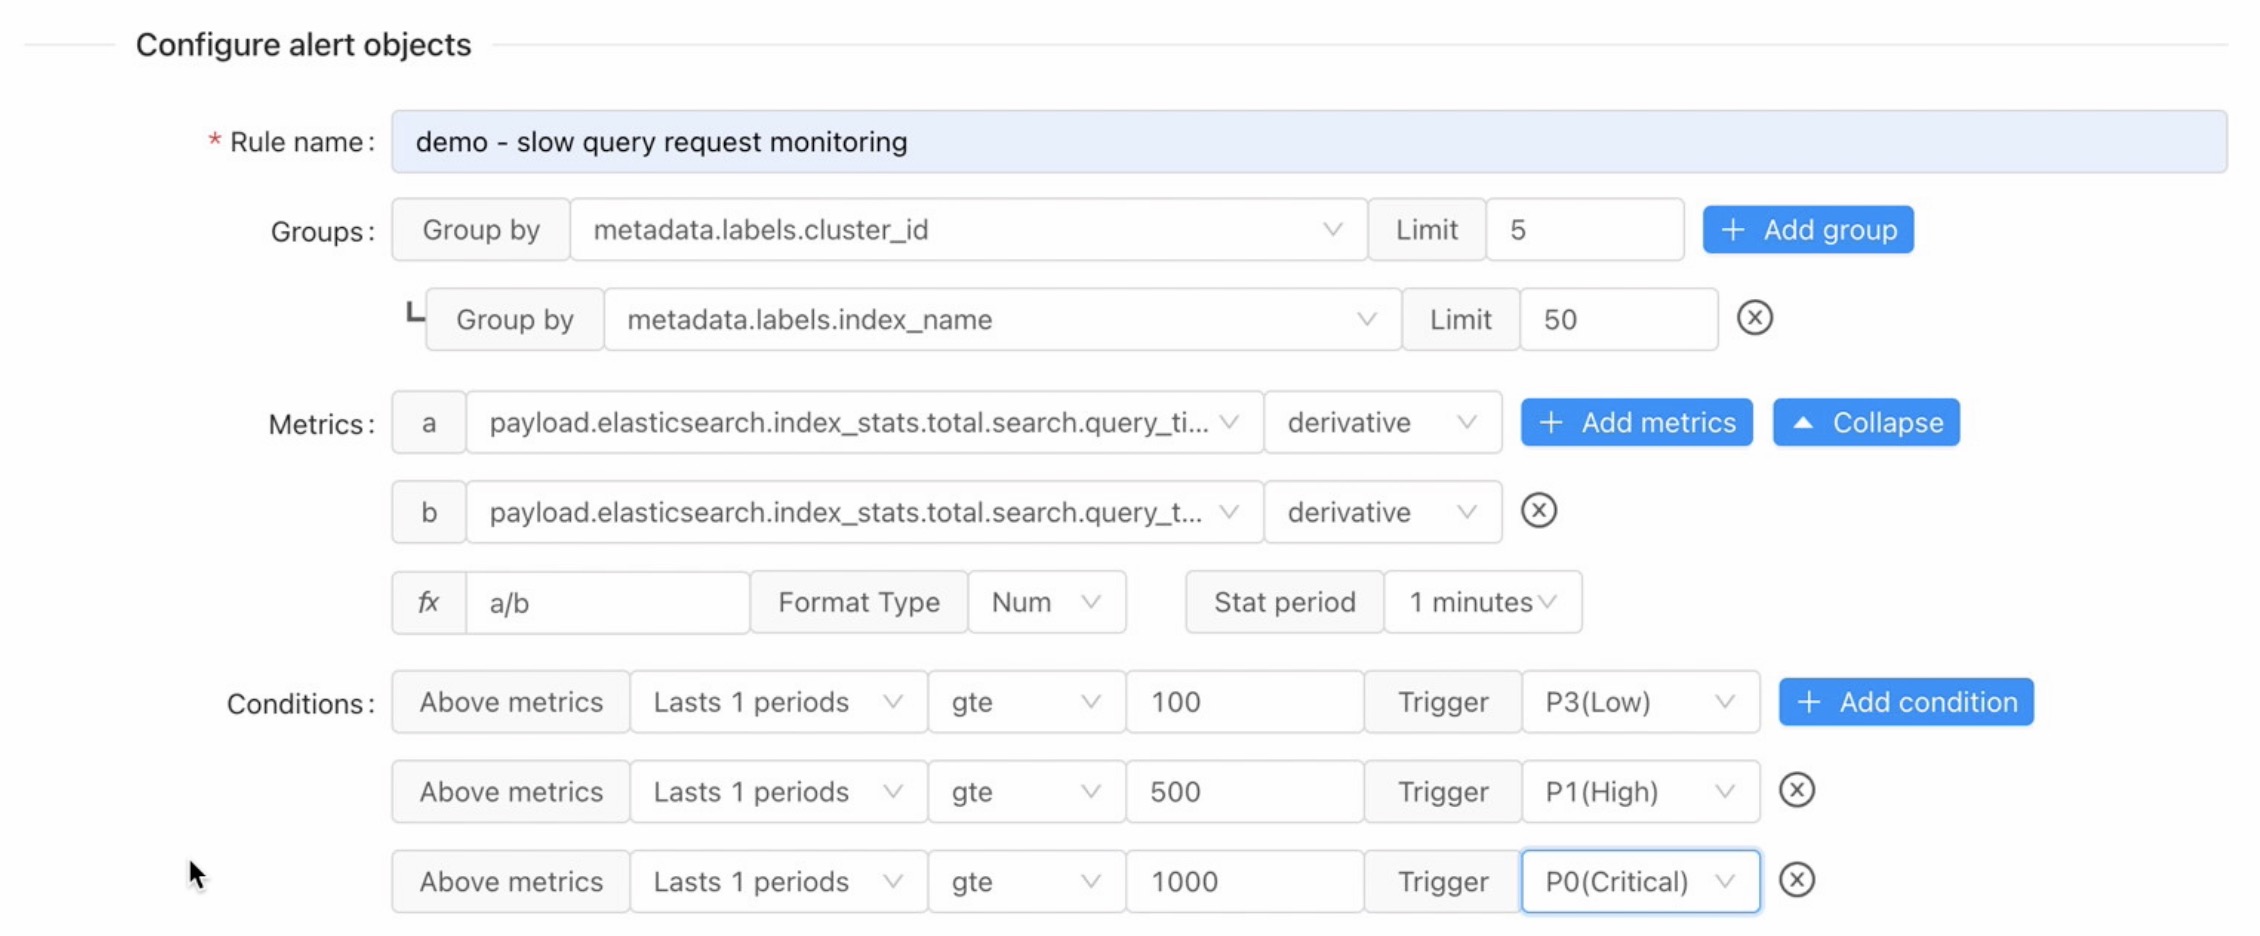
- Input the rule name
- Group settings (optional, multiple can be configured), set when statistical metrics need to be grouped, because all registered to INFINI Console
The Elasticsearch cluster monitoring metrics are stored in the index
.infini_metrics, so you need to group according to the cluster ID first, and then group according to the index name, Here we choosemetadata.labels.cluster_idandmetadata.labels.index_name - Configure the alerting metrics, select the aggregation field
payload.elasticsearch.index_stats.total.search.query_time_in_millis, and use the statistical method to derivederivative. Then add another alerting metrics, select the aggregation fieldpayload.elasticsearch.index_stats.total.search.query_total, and the statistical methodderivative. - Configure the metrics formula (when more than one alerting metrics is configured, you need to set a formula to calculate the target metrics), where the formula fx is configured as
a/bto calculate the delay, - Configure the alerting conditions, three alerting conditions are configured here, and when the
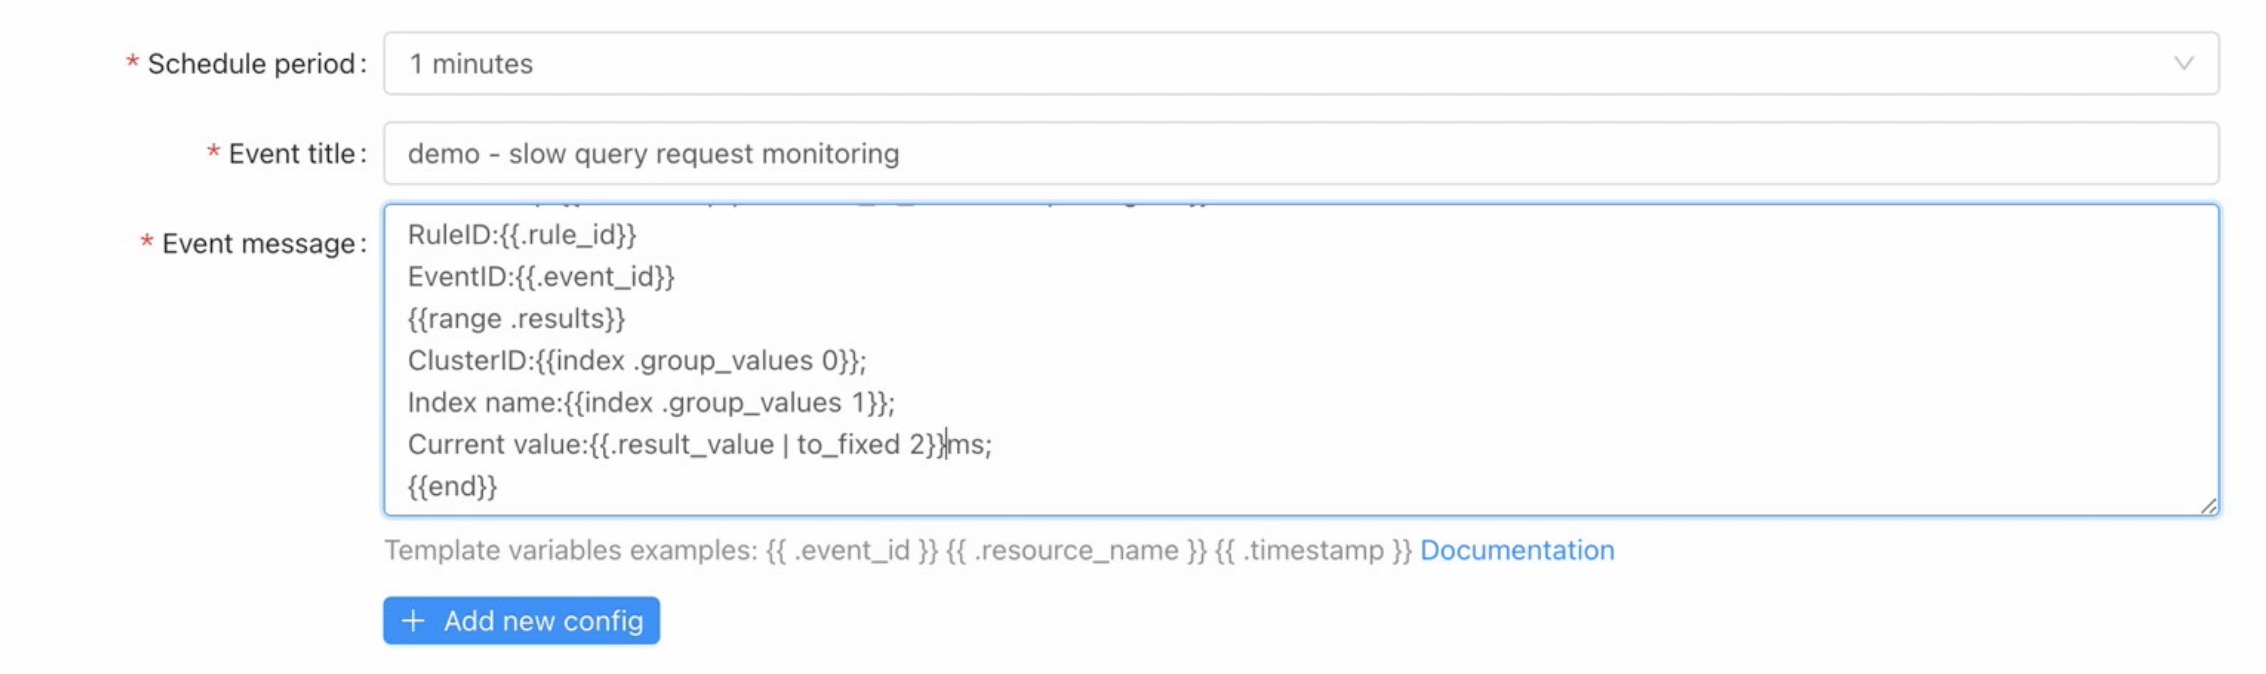
continue for one cycledelay is greater than 100, theP3(Low)alerting is triggered; Configure theContinue for one cycledelay when the delay is greater than 500, trigger theP1(High)alerting; Configurecontinue for one cyclewhen the delay is greater than 1000, trigger theP0(Critical)alerting; - Set the execution period, here is configured to execute a check every minute
- Set the event title, the event title is a template, you can use template variables, template syntax and template variable usage reference here
- Set the event content, the event content is a template, you can use template variables, template syntax and template variable usage reference here
Priority:{{.priority}}
Timestamp:{{.timestamp | datetime_in_zone "Asia/Shanghai"}}
RuleID:{{.rule_id}}
EventID:{{.event_id}}
{{range.results}}
ClusterID:{{index.group_values 0}};
Index name:{{index.group_values 1}};
Current value:{{.result_value | to_fixed 2}}ms;
{{end}}
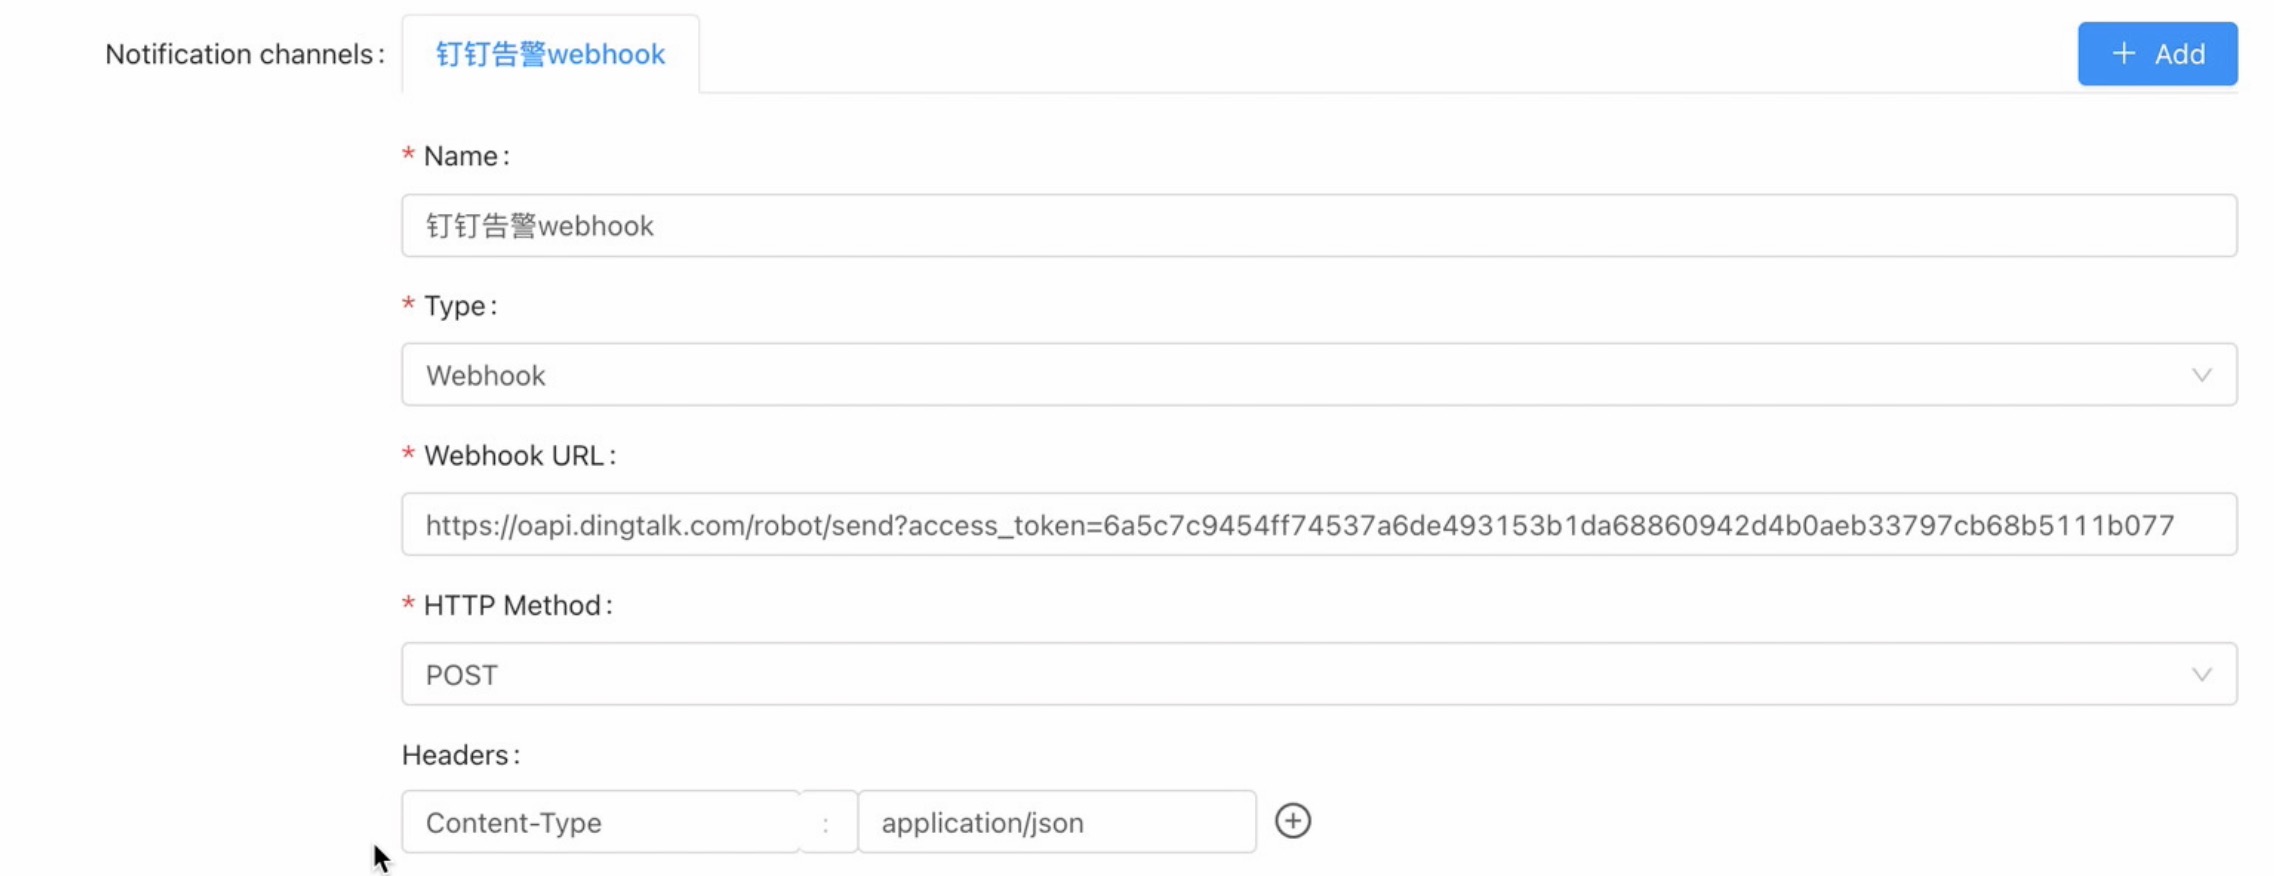
- Turn on the configure alerting channel switch, and select
addin the upper right corner to quickly select an alerting channel template to fill. For how to create an alerting channel template, please refer to here - Set the silence period to 1 hour, that is, after the alerting rule is triggered, the notification message will only be sent once within an hour
- Set the receiving period, the default is 00:00-23:59, that is, you can receive notification messages throughout the day
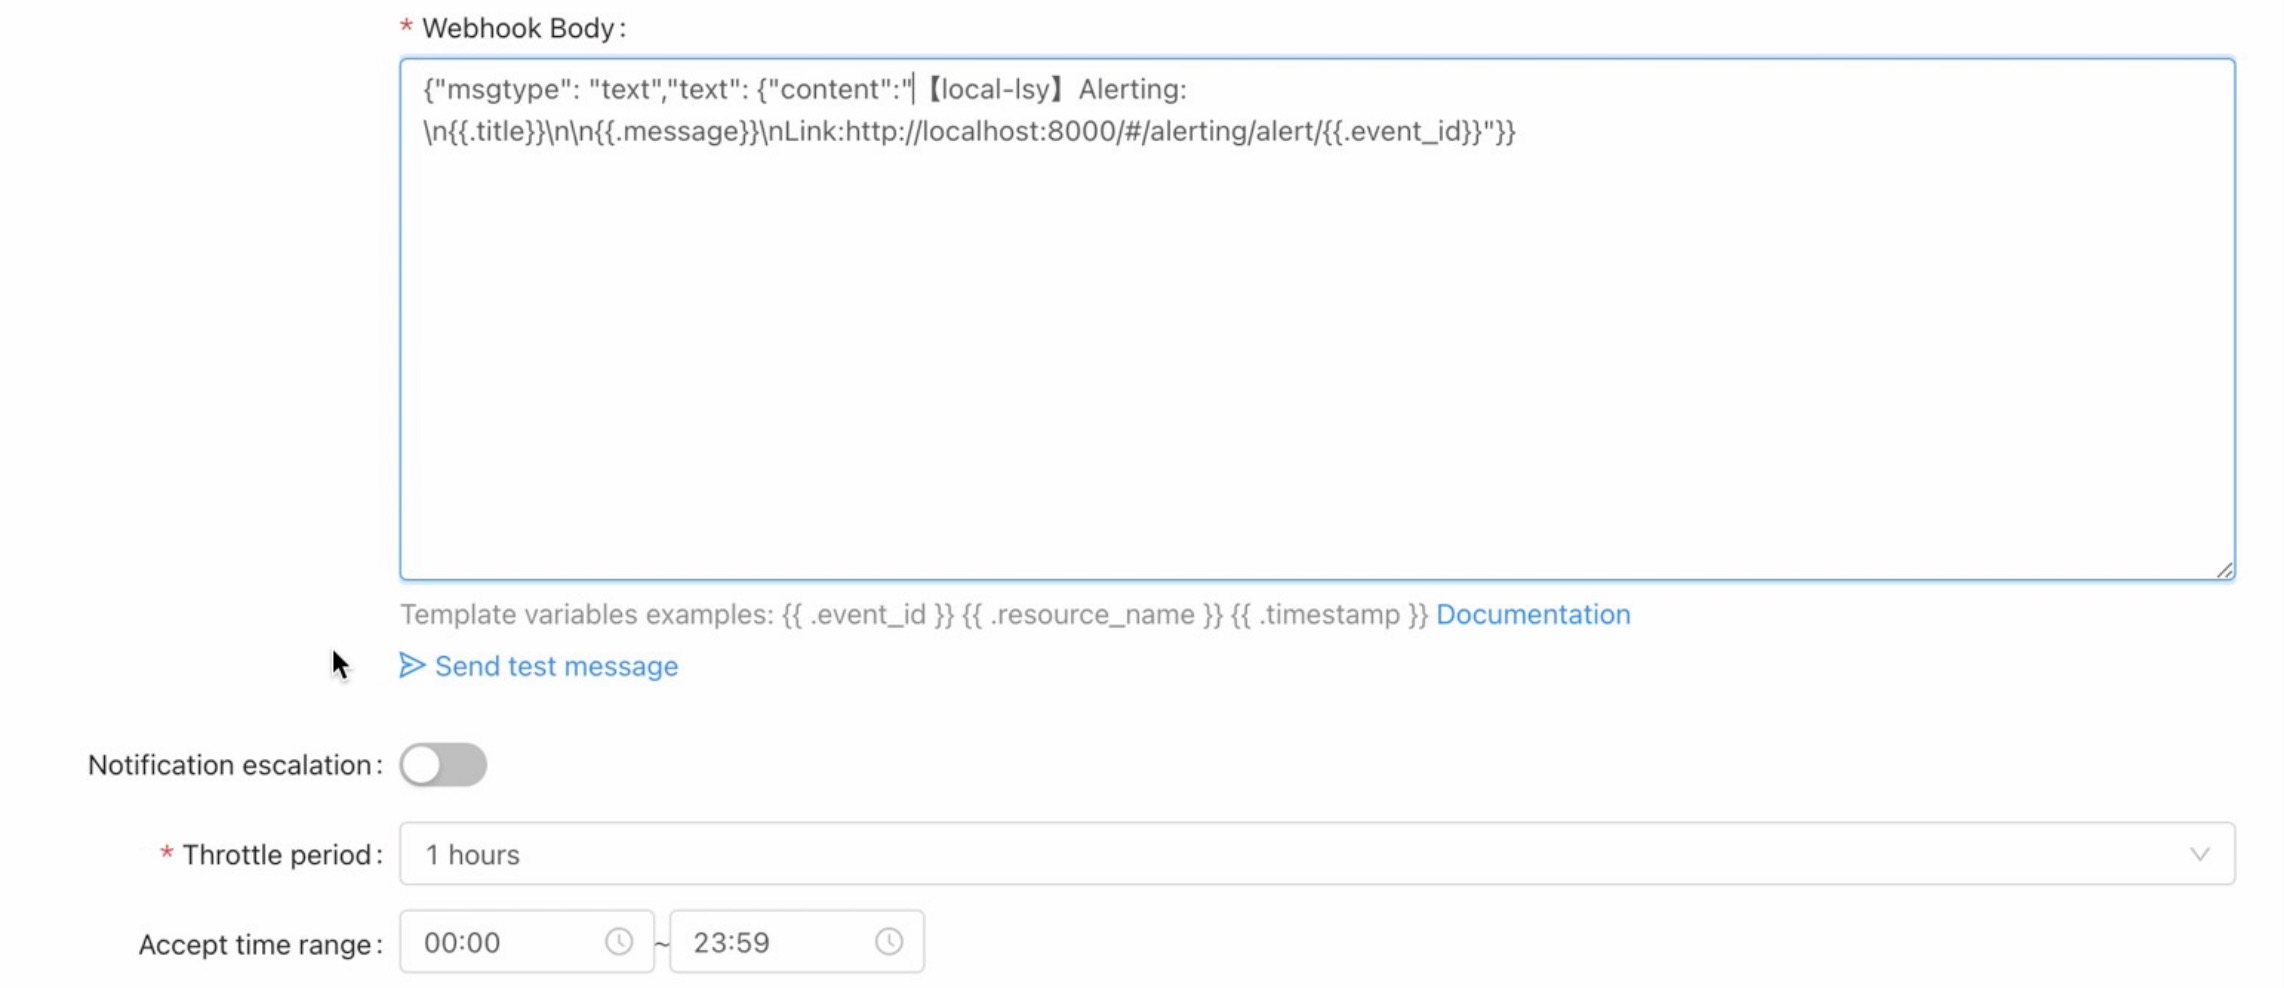
After the settings are complete, click the Save button to submit.
Receive alert notification message #
Wait for a while, and receive the DingTalk alerting message notification as follows:
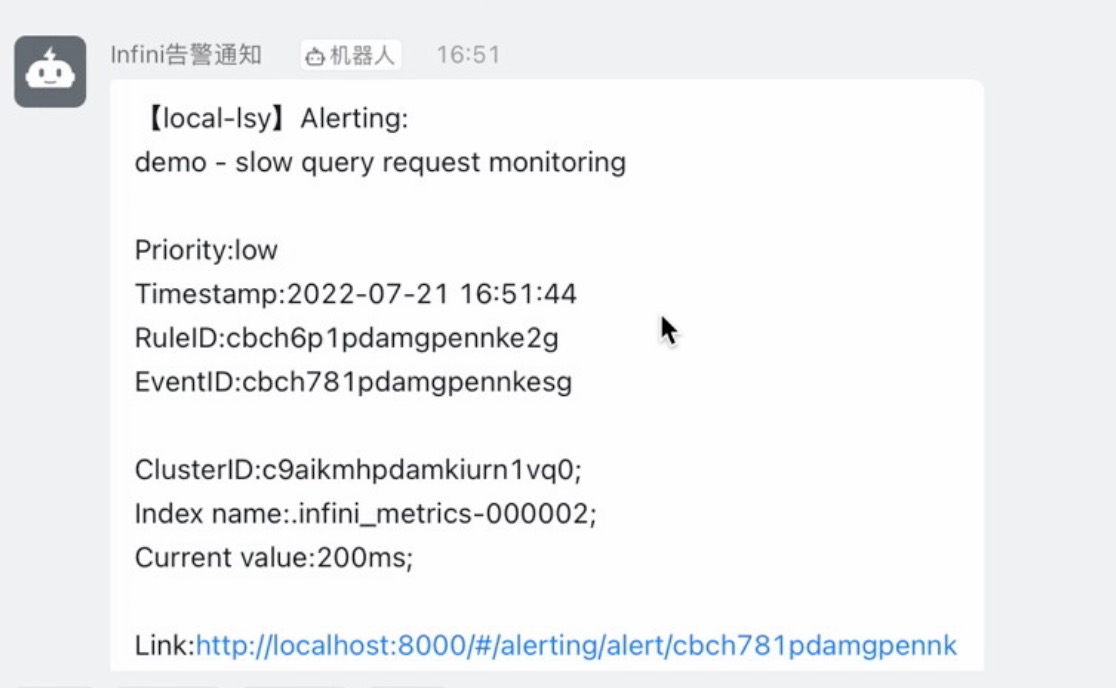
You can see that the alerting notification message shows the Elasticsearch cluster ID, index name, and delay size of which query delay is too high.
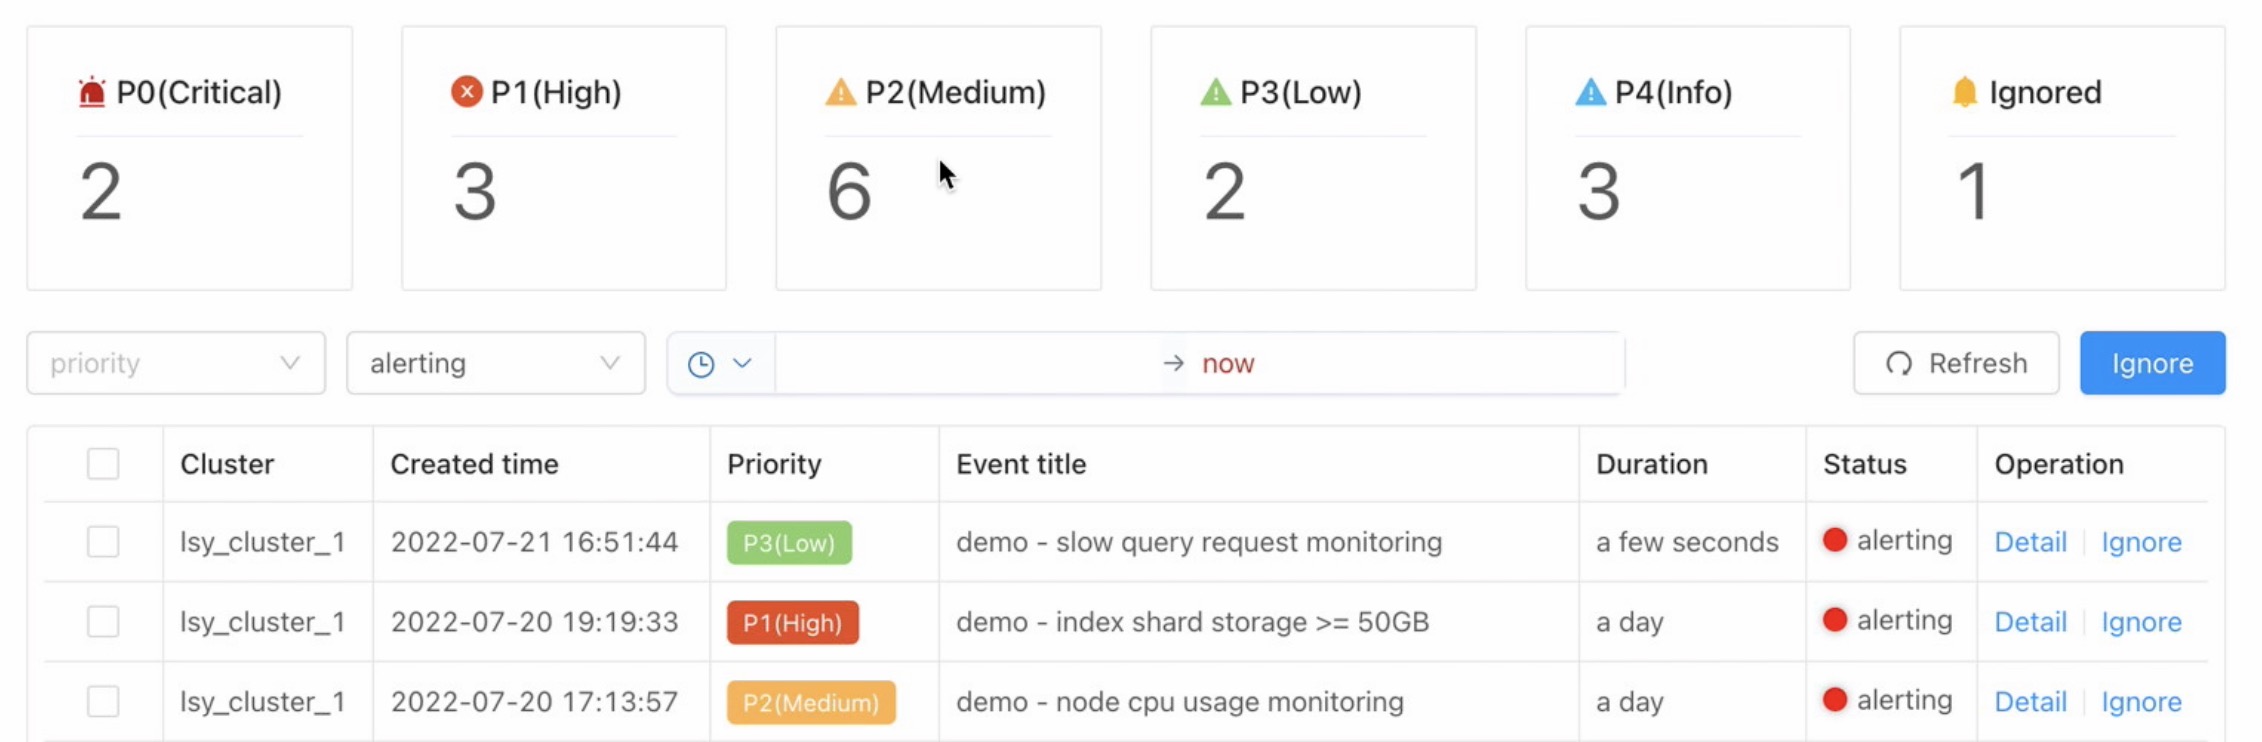
View the alerting message center #
In addition to receiving external notification messages, the INFINI Console Alert Message Center also generates an alert message. Click menu Alerting > Alerting Center to enter
Summary #
By using the INFINI Console alerting function, you can easily monitor the slow index of the Elasticsearch cluster. After configuring alerting rule, Once any Elasticsearch index query latency is too high, an alert will be triggered and an alert message will be sent.